Search results and measurement
Conversion rate: meaning and practical example
Conversion rate is the proportion of the measured units that completed a defined goal. It may be calculated using converting sessions or converting users, for example. The metric is clear only when the goal, counting unit and reporting period are specified.
Also known as: CVR
At a glance
- State exactly what is divided by what alongside the formula.
- The share of converting sessions differs from the number of events per session.
- With a small sample, a few outcomes can change the percentage dramatically.
On this page
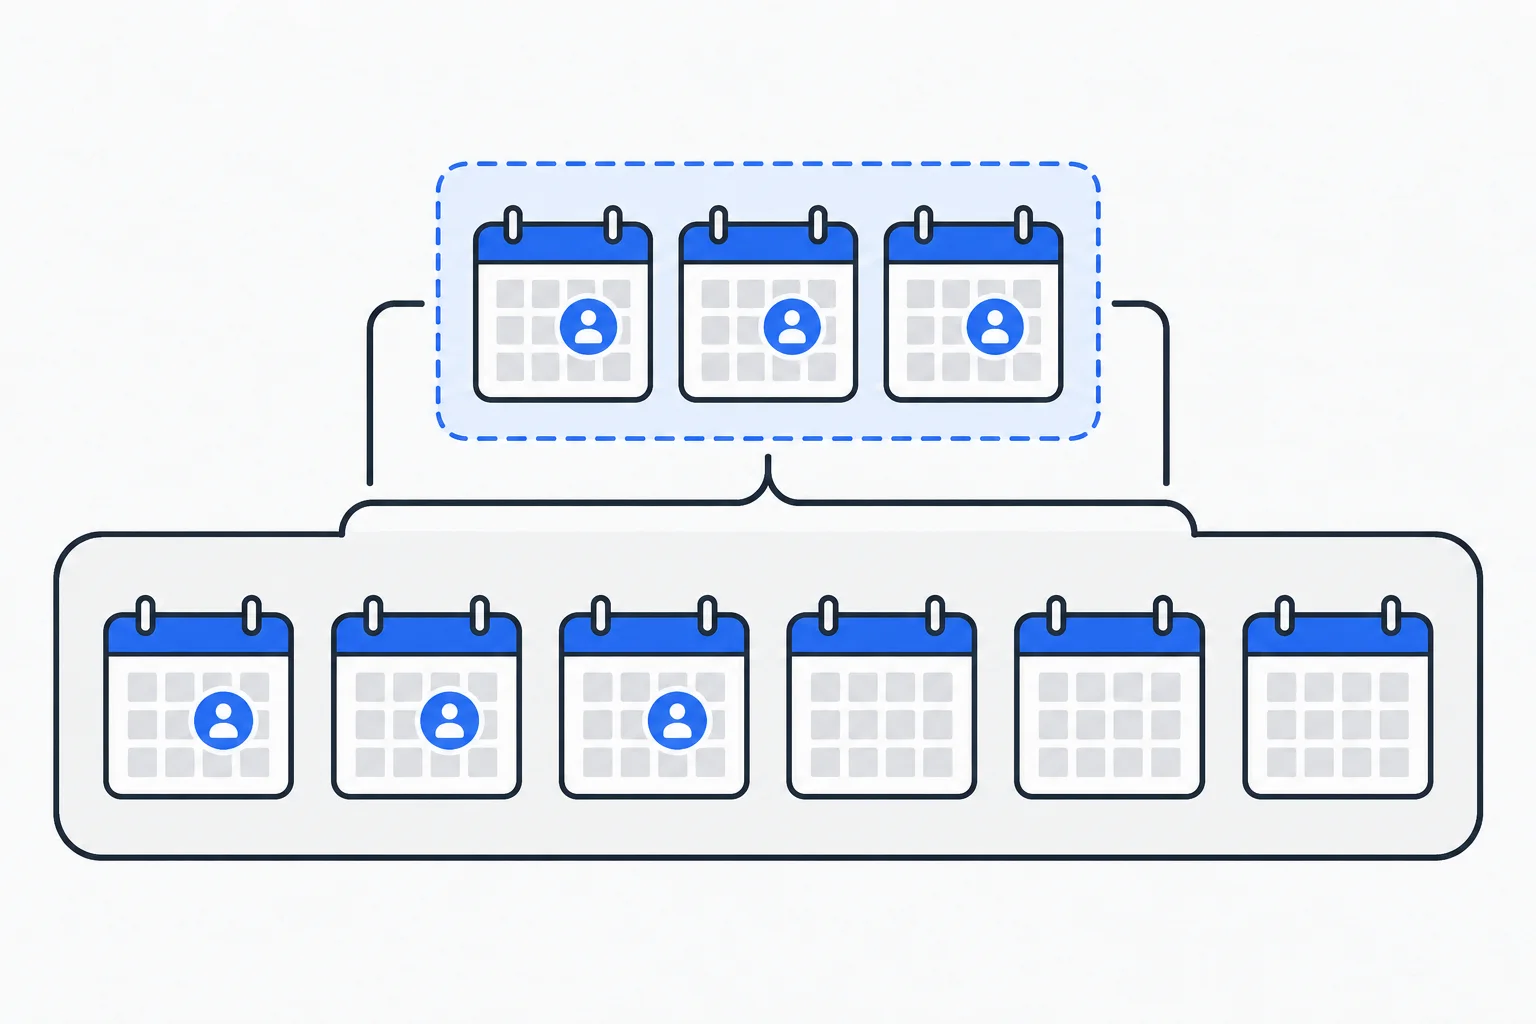
What is the conversion-rate formula?
Divide the number of units completing the goal by all units examined, then multiply by 100. The crucial point is what “unit” means. Visits, users and campaign clicks answer different questions.
A session-based formula is: converting sessions / total sessions × 100. If 20 of 500 visits include a valid quote request, the rate is 4%. The conversion here is receipt of a request, not pressing the submit button. Interpretation begins with that precise goal.
Why does the denominator matter?
One person can return several times, and one visit can produce multiple outcomes. User counts, sessions and conversion-event counts are therefore not interchangeable. All may be useful in a report, with different meanings.
| Question | Possible metric |
|---|---|
| What share of visits produced an outcome? | Converting-session rate |
| What share of people achieved the goal at least once? | Converting-user rate |
| How many outcomes occurred per visit? | Event count divided by session count |
The last ratio can exceed one when repeated outcomes occur. That does not mean more than 100% of sessions converted. The Google Analytics API schema distinguishes its metric definitions.
Example: two articles with different audiences
Imagine a carpenter comparing two pages. A wood-care guide receives eight quote requests from 800 sessions: 1%. A custom-kitchen page receives six from 100 sessions: 6%. The guide produced more inquiries; the kitchen page converted a larger share.
This does not establish that the guide should be removed. It answers a different question, and a reader may request a quote later through another page. Consider each page's purpose, visitor needs and inquiry value. The figures are illustrative only.
Why can the rate change without a page change?
The traffic-source mix may shift. More early-stage researchers can reduce the overall rate even when the request process works identically. Seasonal demand, stock availability or different service territories can also alter the audience.
Measurement changes matter too. A renamed event, new counting rule or duplicated analytics event can move the report without business improvement. Investigate definitions and collection before attributing a large change to wording or buttons.
What is a good conversion rate?
No percentage is universally good. A free download, an expensive-service inquiry and a paid purchase require different commitments. Industry averages often omit the exact goal, denominator and traffic mix, making comparisons unreliable.
Start with your own consistently measured processes. Include absolute counts: one outcome from ten visits and 100 from 1,000 are both 10%, but the first is much more sensitive to another visit. A short period cannot establish lasting improvement.
How can it guide content decisions?
Review search CTR, incoming visits, the path to the goal and actual outcomes together. If people reach a form but encounter errors, repairing the process takes priority over new articles.
If a recurring decision question remains unanswered, a clear explanation may help. Evaluate it with consistent metrics, sufficient observations and awareness of traffic changes. A percentage indicates direction without identifying the cause.
Conversion rate optimization then investigates which obstacles to address. A higher rate alone establishes neither better customer quality nor greater revenue.